When we surveyed 118 L&D leaders for our learning strategy benchmarking research, one finding stood out above everything else: organizations with a documented learning strategy scored 26 points higher on maturity than those without one. Not a little higher. A full tier higher on the maturity scale.
And yet, over 80% of organizations scored at the bottom two maturity levels. Most had moved past purely reactive, compliance-driven learning but they hadn’t yet reached strategic impact.
The gap between “we have priorities” and “we have a strategy” is real. The biggest barriers in the data weren’t budget or headcount. They were measurement (teams report metrics but don’t have data that drives decisions), governance (decisions get made without consistent structures), and the link between learning and business KPIs (L&D teams are in the room with executives but haven’t connected their work to the numbers leadership cares about).
Strategy on a Page (SOAP)
When we work with organizations, the first thing we do is compress everything into a single view called a Strategy on a Page (SOAP). It captures who the L&D function is, how it works, and the initiatives that will move the business forward.
Why one page? If you can’t fit your strategy on a single page, you probably haven’t made the hard choices about what matters most. And a one-page strategy gives you something a 40-slide deck never will: a shared reference point that everyone actually uses. It becomes the thing your team points to when setting priorities, making investment decisions, and choosing what to measure.
The template is straightforward: identity on the left, guiding principles at the top, four strategic focus points with targets underneath. Your team has to agree on four key focus points, and that means deciding what doesn’t make the cut. Those conversations surface misalignment that’s easy to ignore when the strategy lives across multiple documents. A few patterns come up every time we run this process:
- Identity is where alignment breaks. Most L&D teams haven’t written down why their function exists. That matters because every other choice on the page flows from it including your focus points, your principles, your targets. Without shared answers, the strategy pulls in competing directions before you’ve even started.
- Four strategic focus points is a deliberate constraint. The template forces you to choose four. That feels too few when your list of priorities is twice that, but that constraint is the point. If everything’s a priority, nothing gets measured.
- Specificity makes a strategy testable. “Build a learning culture” isn’t something you can measure. “Reduce time to role readiness by 20% in 12 months” is. That specificity is what makes the bridge to measurement possible.

Measuring what matters (vs. what’s easy)
In our research, most L&D teams were reporting metrics to leadership. That part isn’t the problem. The problem is those metrics rarely change what anyone does next. A SOAP changes what you measure because it changes what you’re asking. Instead of ‘how many people completed the program?’ the question becomes ‘is this initiative producing the result we said it would?”
For each initiative on your SOAP, two filters help:
What decision does this measure inform? Every KPI on an executive dashboard or in a report should connect to an investment decision, a governance trigger, a capability question, or a performance outcome. If a number moves and nobody’s behavior changes, it’s not a KPI, it’s just a data point.
What would you actually notice if this initiative were working? This is the question that shifts your measurement from activity to impact. There’s a useful distinction here. Most L&D dashboards track whether people showed up and whether they liked it (reaction and knowledge). The measures that inform decisions track what changed after: are people doing something different on the job, and is the business seeing a result from it (behavior and outcomes)?
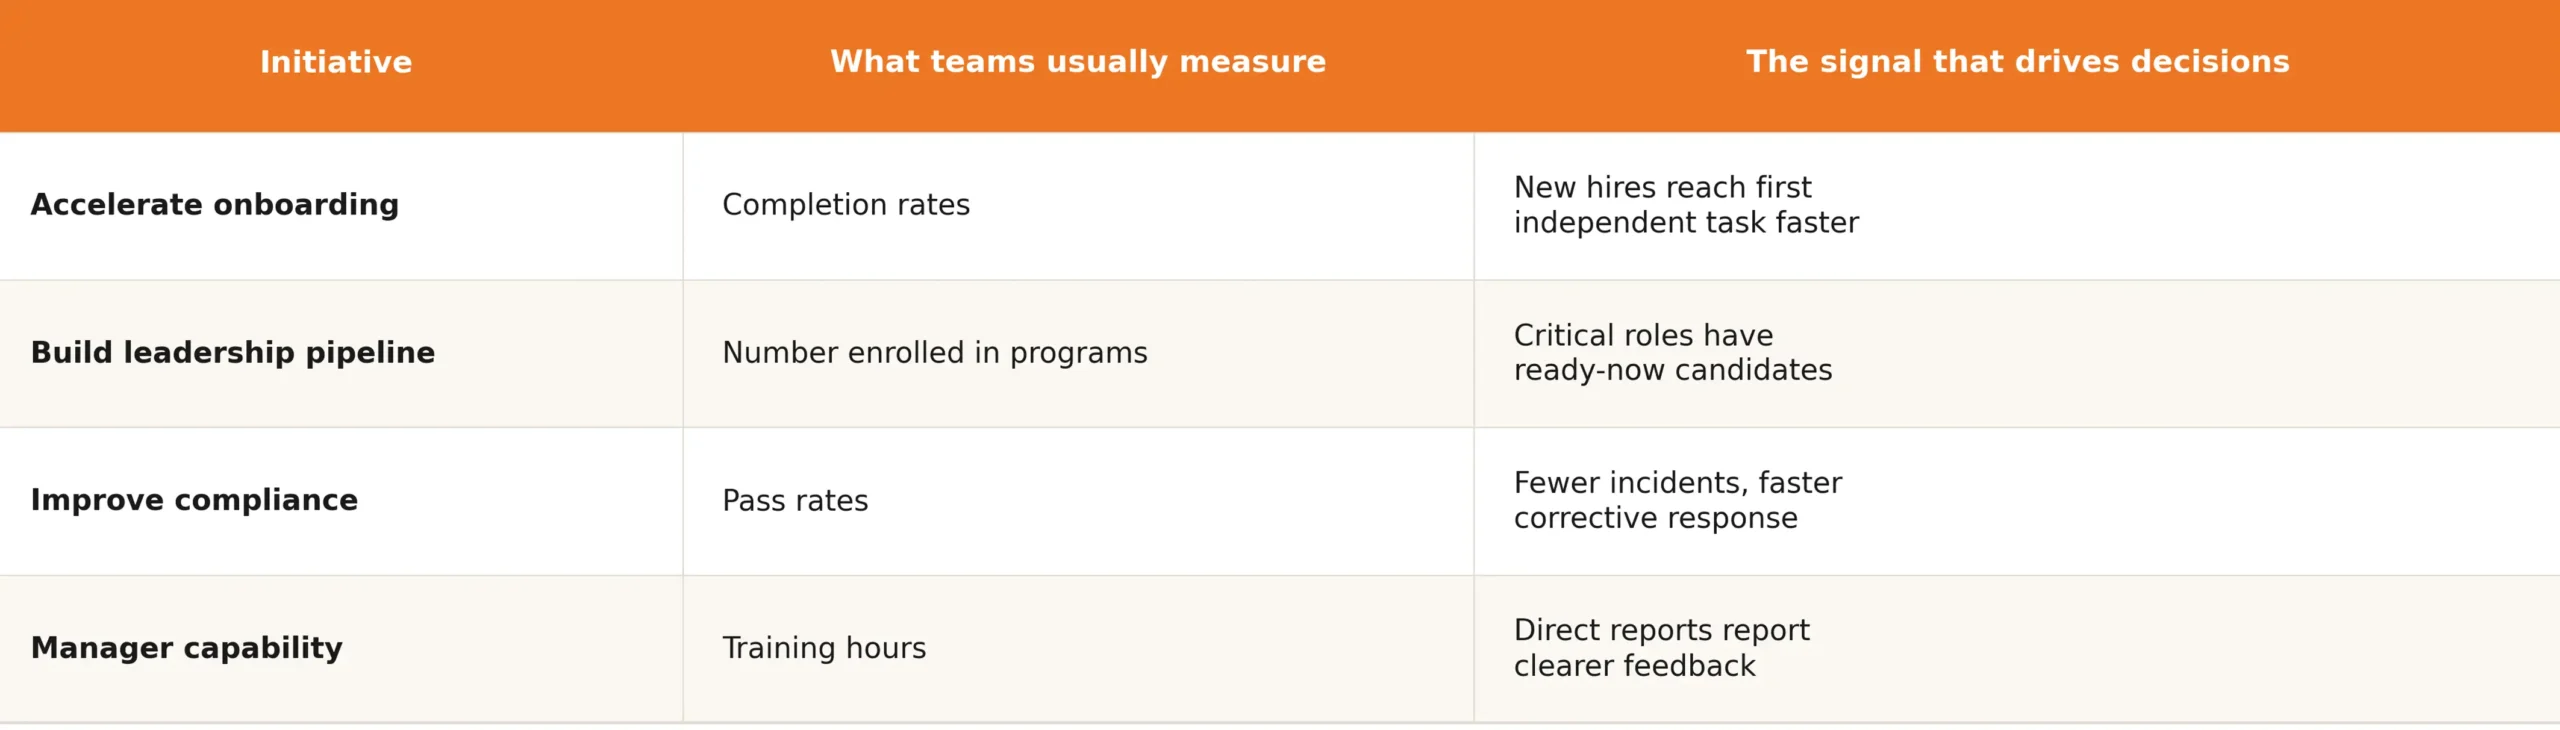
Typically teams measure reaction and knowledge because the data is easy to pull from a learning platform. The problem (most of us already know!) is that completions and satisfaction scores don’t help an executive decide anything. They need to know whether onboarding is producing independent contributors faster, whether leadership development is filling the pipeline for critical roles, or whether compliance training is reducing actual incidents.
Here’s what that shift might look like across a few common initiatives:
The same number, three ways
Most measurement breaks down not because the data is wrong, but because different stakeholders are looking at different versions of the same number. One practice that makes measurement stick across an organization is viewing each KPI at three levels. Here’s what that looks like for a single initiative, say, “accelerate leadership readiness for critical roles”:
Executive view: Are we building leadership capacity fast enough? The CLO sees a single readiness metric across critical roles.
Portfolio view: Where is it working and where isn’t it? L&D leaders see readiness broken down by business unit and development track.
Practitioner view: What do we adjust this week? The execution team tracks whether programs have defined outcomes, whether managers are reinforcing them, and how quickly new programs get deployed.
Same definition. Same data source. When those three views line up, stakeholders will trust the numbers. When they don’t, that trust is hard to rebuild.
Which raises a practical question before any of this gets shared: who owns each number, and who can act on it? (The governance piece). Without that clarity, metrics tend to get used selectively – quoted when they support a case and quietly ignored when they don’t.
Your measurement checklist
If you’re building or refreshing your approach to measurement, here’s what we’d focus on:
- Each KPI ties to a specific SOAP initiative
- Each KPI informs at least one decision: investment, governance, capability, or performance
- You’re measuring behavior or outcomes, and not just activity
- Same definition at executive, portfolio, and practitioner levels
- Each number has a named owner and clear authority to act
- 5-7 KPIs at the executive level
- Review cadence matches how fast the measure can realistically move
- You can answer “if this number moves, what changes?”
We wrote a guide that walks through our four-step process for building a learning strategy, with examples and a fillable Strategy on a Page template you can use with your team.
Check out: Beyond training; crafting learning strategies that transform organizations
If you’d like help translating this to your situation, we’d love to talk.